February 15, 2024
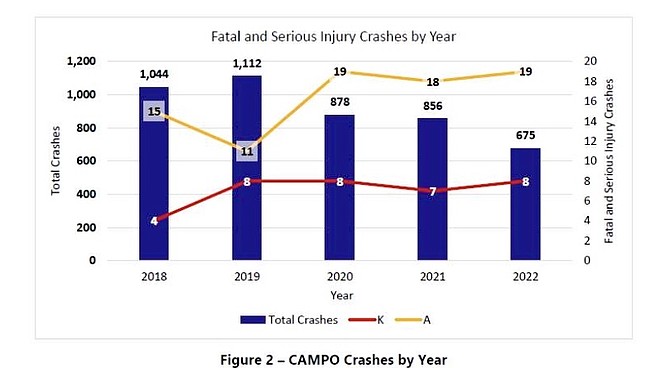
Graph provided by CAMPO showing total crashes in CAMPO areas from 2018 to 2022. Fatalities are represented by the ‘K’ line, and serious injury crashes are represented by the ‘A’ line.
Transportation officials are developing a Local Road Safety Plan that evaluates problem areas and prioritizes safety measures and projects.
Comments
Use the comment form below to begin a discussion about this content.
Sign in to comment